Cette entrée n'est pas traduite. Vous lisez le texte anglais. Aller à l'original anglais
What it does
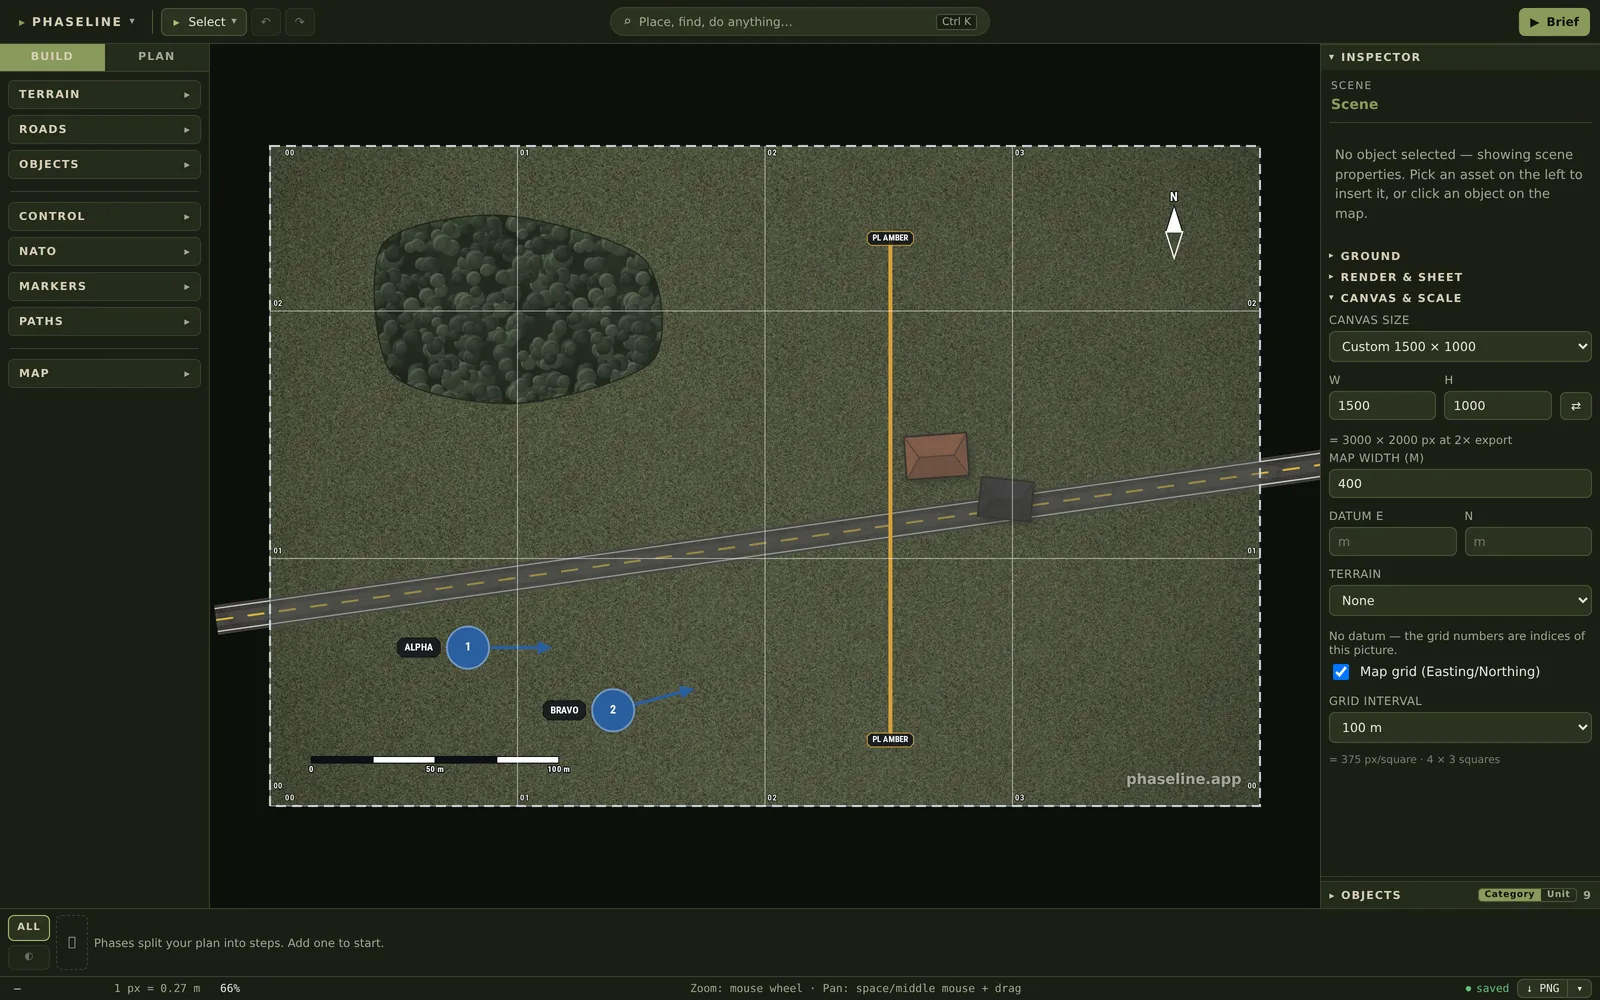
Give the map one number: its width on the ground, in metres. Phaseline then knows the distance of every pixel. The scale bar shows the correct length, the measure tool (M) reads in metres, and the status bar shows the scale. The map grid divides the map into squares of a round size, and it writes a number on each line.
Why it is there
A briefing map with no scale is a picture. Two persons look at the same gap between two woods, and one of them calls it 200 m while the other calls it 600 m. The plan then gets a march rate that is too fast and a support-by-fire position that is too far away. One number removes the argument, because every other measurement on the map comes out of it.
How to use it
- Click on an empty part of the map. The INSPECTOR on the right then shows the properties of the scene.
- Open the Canvas & scale block.
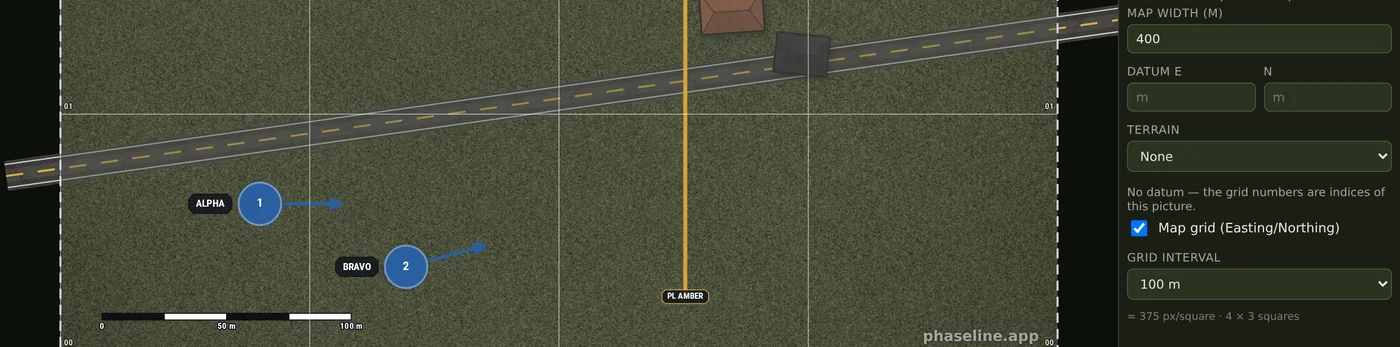
- Put the width of the map on the ground into Map width (m). The example map is 400 m wide.
- Read the status bar at the bottom of the window. It now shows the scale, for example 1 px = 0.27 m.
- Select Map grid (Easting/Northing). The grid comes onto the map, and each line gets a number.
- Select the distance between two lines in Grid interval. Only powers of ten are available.
- Read the line below the list. It gives the size of a square in pixels and the number of squares, for example = 375 px/square · 4 × 3 squares.
- Push M for the measure tool, then drag a line on the map. The length is in metres.
On the map
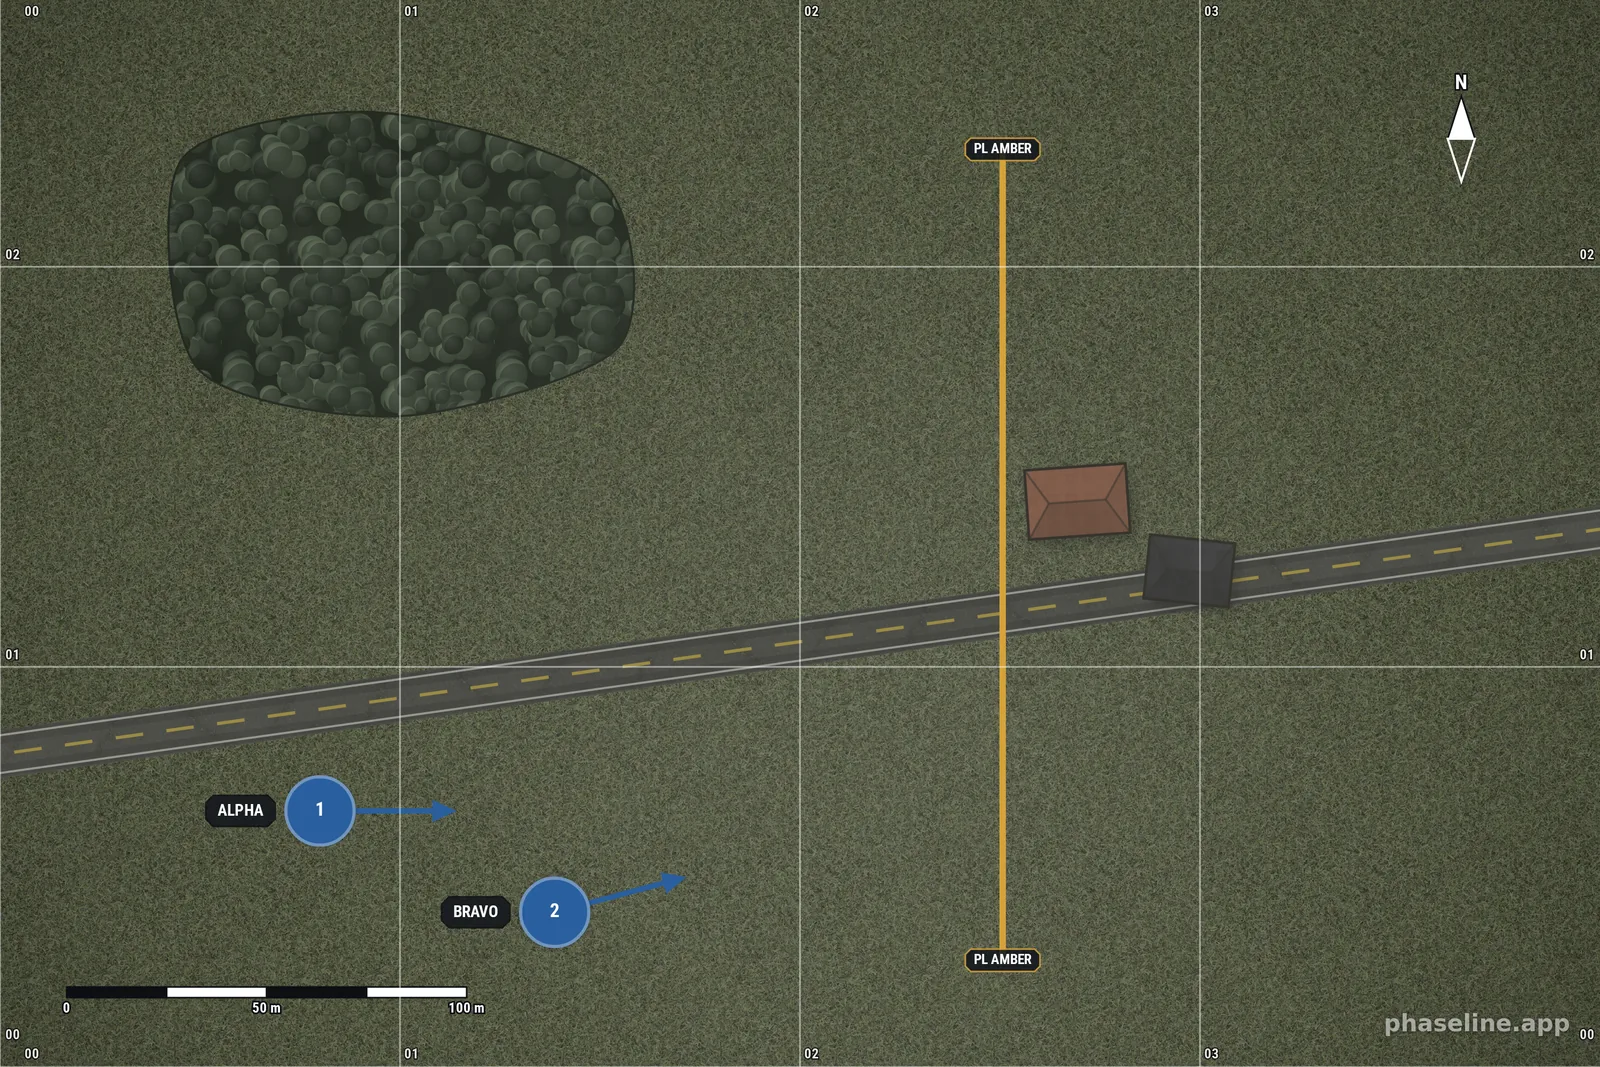
The example is a 400 m map with a 100 m grid. The scale bar, the numbers on the grid lines and the metres of the measure tool all come from the one value in Map width (m). Open the scene and put 800 into that field: the map does not change, but every distance on it becomes twice as long.
Limits
- The map width applies to the full canvas. You cannot give one part of the map a different scale.
- Only powers of ten are available as an interval. A 250 m square is not possible, because the digits of a grid reference are the coordinate in metres.
- An interval is available only when it makes 3 to 40 squares on the longer side of the map. A map 400 m wide gets 10 m and 100 m, and nothing else.
- The Editor grid (G) in the menu is a different grid. It helps you to put objects in position, and it is not in the PNG.
- With no map width the grid has a cell size in pixels, and its numbers are indices of the picture and not grid references.
- The map width also carries the Datum of the scene. If you empty the field, the scene loses its datum, because a datum is metres and there are no metres without a scale.
Related
- Grid references — how to read the numbers that this grid writes.
- The window, and your first map — where the Inspector is, and the seven steps before this one.
- Mastering the sand table — why a scale and a legend come before the units.
- All the entries of this handbook — one page for each function of the editor.